Complete Street Policy unencumbered by political process. Walk-bike-skate-bus or rail, give street access to people, not just cars.
Sunday, February 26, 2023
The Problem with City Revenue
Tuesday, February 14, 2023
Parking Rates at Eleven Parking Structures I
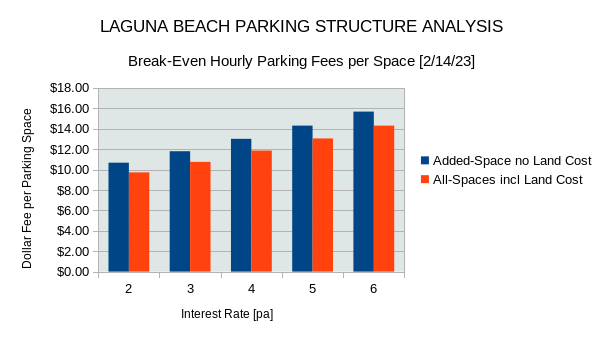
The 10 January 2023 Agenda Report prepared by the LB Parking Master Plan Subcommittee calls for embellishing eighteen parking lots and constructing eleven new parking structures . Table-2 of this report gives a summary of the parking structures labeled Projects H-R, their street locations in Laguna Beach, the number of parking spaces added and the capital cost of construction. Assuming 30-year financing and 40-year life the chart shows the minimum hourly parking rate necessary to breakeven with the amortized costs over the 40-year structure life.
The analysis considers costs of construction, debt service, demolition, salvage, in-lieu parking fees, maintenance and other costs in the amortization over the structure lifetime. Not included: parking enforcement, opportunity costs, environment factors (quakes, floods), depreciation, inflation and taxes (if applicable). These results are preliminary and may be updated as project information is made available. In the chart the Presbyterian Church parking structure is labeled Project M: 355 Third St.
-LS
Saturday, February 11, 2023
Parking Structure Economics 101
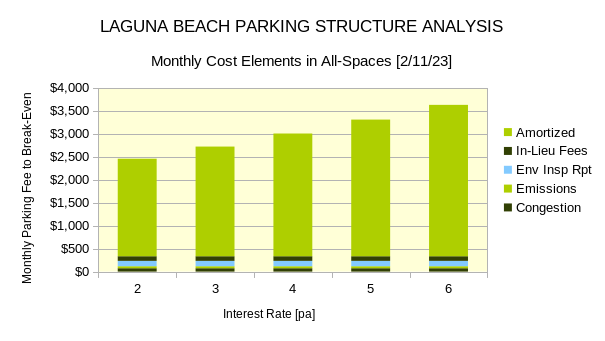
Automobile parking structures are very expensive to build and operate, particularly near the beach. The 10 January 2023 Agenda Report prepared by the LB Parking Master Plan Subcommittee calls for embellishing eighteen parking lots and constructing eleven new parking structures with no amortized cost information given. An analysis shows what happens when a typical structure is erected near the beach, paid for by debt financing, operated for 40-years and demolished for salvage value after its useful life in the year 2065. When all the costs for such a structure are accounted for the true cost of these structures becomes clear.
The cost to build parking structures is subsidized in city finances that the motorist does not pay for. The chart shows the hourly parking fee for a single parking stall if the parking fees alone paid for the structure, this is the amount just to break-even on cost with no revenue left-over for other purposes. From the chart at 4% interest the parking fee is over $10 per hour. If the parking rate is set at $5/hour, who pays for the remaining $5? The answer is everybody but the motorist.
This study considered a parking structure to support 95 cars, construction costs of $20-million, 30-year financing, 40-year lifespan, operation and maintenance costs. NOT INCLUDED: parking enforcement, opportunity costs, environment factors (quakes, floods), EIR response, depreciation and inflation.
To bound the problem two approaches were taken, the first determines the cost per parking space added to the existing land footprint, it considers construction costs without consideration for land values. The second approach considers all parking spaces developed including land value and in-lieu parking fees.
This study shows the structure costs are most sensitive to the type of construction; above ground or below and the number of parking spaces delivered to the project. Given the cost of these structures and the subsidy borne by the city and residents, the Master Plan Subcommittee is urged to check their Math.
-LS
Wednesday, February 1, 2023
LB City Net-Revenue by Modeshare
For 2023 Laguna Beach will have a City Budget of $125 Million, how is that money spent on our mobility system? Past budgets show money is spent on car parking and transit but insignificant amounts spent for cycling and pedestrian mobility.
The chart shows the net amount spent, city revenue minus expenses from our budgets in 2007 to 2021 for each transportation mode: driving, transit, cycling and walking.
Results from each mode show:
Driving: only automobiles show a net positive revenue mostly from parking meters and vehicle fines, but paying for eleven expensive parking structures to park visitors cars will eliminate that revenue (see JT analysis).
Transit: looses money for every year it operates, it must be subsidized from other funds to continue.
Cycling: No investments were made in bicycle infrastructure, no revenues were generated, no expenses recorded.
Walking: No investments were made for pedestrian infrastructure, no revenues generated, no expenses recorded.
Conclusions: With no investment in all four mobility modes, expect the trend in these charts to continue. Building 18-parking lots will increase visitor car traffic, net revenue will fall, traffic will increase, parking occupancy will increase.
Footnotes: There are indirect revenues and expenses not accounted for here, like parking enforcement for cycling. In 2012 The Village Entrance book cost was $12.8 Million shown here distributed across all four modes equally. For comparison purposes the amount from Net Business Improvements are compared with the four modes. Net Business Improvements are Retail Sales minus Tourist Marketing minus Community Support funds.
-LS
LB City Expenses by Modeshare
A review of the budget for Laguna Beach shows the City generates more city revenue from automobiles and parking than any other transportation mode and in some years the amount exceeds revenue from total retail sales and OCC Hotel Taxes. In a study of the LB City budget for 2007 to 2021 the first chart shows the Expenses to sustain the operation of four mobility modes.
In 2012 The Village Entrance book cost was $12.8 Million, as shown here distributed across all four modes equally. For comparison purposes the amount from Business Incentives (tourist marketing costs) are compared with the four mobility modes. Business Incentives are Tourist Marketing expenses in the budgets.
-LS


