These charts show the location of vehicle collisions around Laguna Beach as compiled by the Transportation Injury Mapping System. Each chart (click to enlarge) shows the number of recorded collisions, the location, the mode of transportation for eleven years 2003-2013.
The first three charts show the hot-spots around Laguna where collisions occur most frequently for all modes of transportation in all circumstances. The data shows most collisions are concentrated on South Coast Highway and Laguna Canyon Road. The traffic violation cited most often is Unsafe Speed, the most frequent collision type is Rear-End.
The first three charts show the hot-spots around Laguna where collisions occur most frequently for all modes of transportation in all circumstances. The data shows most collisions are concentrated on South Coast Highway and Laguna Canyon Road. The traffic violation cited most often is Unsafe Speed, the most frequent collision type is Rear-End.
 |
| South Coast Highway / 1362 Collisions / All Modes / 2003-2013 |
 |
| Laguna Canyon Road / 1362 Collisions / All Modes / 2003-2013 |
 |
| Violation: Unsafe Speed 43%, Type Collision: Rear-End 44% most common
The next four charts show collisions are concentrated along state highways no matter the mode of transport. The pedestrian detail shows collisions that occured in the Hip District with case details available for each incident as mapped by the TIMS system.
Pedestrain Collisions
 Pedestrain Detail  Bicycle Collisions  Motorcycle Collisions 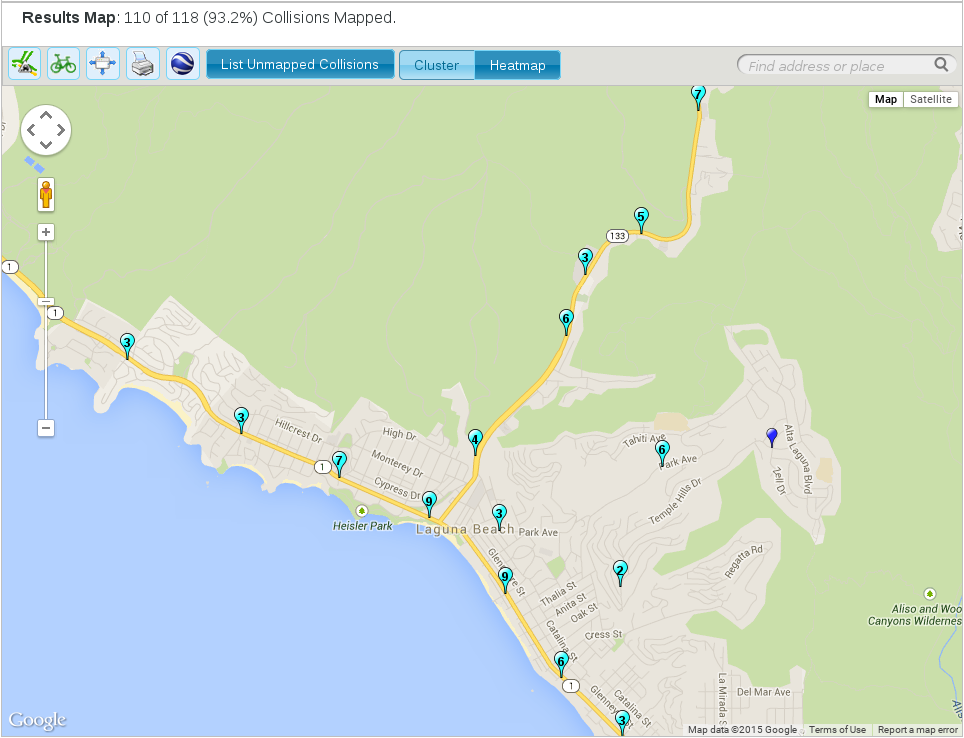 |


