Saturday, June 24, 2023

Forest Children with Chalk

Campaign NYC 25x25 comes from Transportation Alternatives where planners were bold enough to imagine what it would look like to remove one-quarter of the city's automobile occupancy and return it to people by 2025. Not utopian just what is happening in Oslo and Paris right now (full SLATE article).

Removing one-quarter of NYC's 19,000 miles of driving lanes and 3-million free parking spaces, New York City could:  

  •  give pedestrians access to 1,000 miles of streets
  •  car-free block for play, outdoor learning, pickup/drop at 1,700 public schools.
  •  put every resident within a five-minute walk of 500 miles of bus lanes, 
  •  500 miles of (real, car-protected) bike lanes
  •  lease 5.4 million square feet of street space to businesses and nonprofits
  • put public bike parking on every block.
  • plant 15,000 new trees, the equivalent of adding almost Central Park
  • establish hubs for street vendors, benches, trees, public bathrooms, 
  • bike charging, and bike parking outside every subway station,
  • raise billions for transit by metering public parking spaces.  


Children with Chalk  Photo SLATE

-LS

Tuesday, June 20, 2023

Council Approves Parking Management Report

Fehr and Peers
In a well attended session Tuesday June 13 the Laguna Beach City Council adopted (Video 4:28) all Recommendations from city staff with modifications to the Parking and Transportation Demand Management Report (PTDMR). Recommendation #6 removes the Presbyterian church parking structure. These are highlights of those Recommendations approved by Council in a 5/0 vote.

(1) Review and accept the final Parking and Transportation Demand Management Report;

(2) Direct staff to proceed with the implementation of all short-term TDM (reuse) strategies and updates to the City’s parking regulations;

(3) Direct staff to continue the evaluation of medium-term TDM strategies;

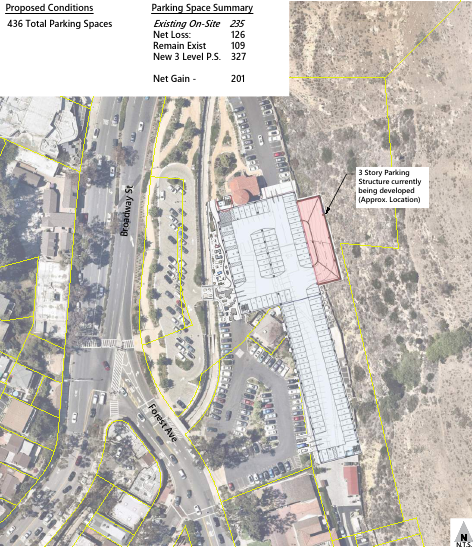
(6) Direct staff to proceed with the next steps for a 3-level 327-space parking structure at 635 Laguna Canyon Road/Farmers Market, 200 added spaces costing $81,343 per added space. Target users are downtown business employees, attendees and volunteers of Playhouse and Festival of Arts;

(8) Direct staff to study the feasibility of remote parking at Act V, 3-level 516-space parking structure at 1900 Laguna Canyon Road, 263 added spaces costing $98,099 per space. Target users are City's fleet of vehicles and trolleys, the general public primarily during summer;
 
(10) Direct staff to review the Complete Streets Mobility Study for "other" potential strategies. 


NOTES:  Since the Council unanimously carried a "motion to adopt", all PTDMR parking lots and parking structure projects remain in consideration.  The 13 June Agenda Item #14 and staff report make no clarification to "complete streets" in 226-pages, no commitment for funding or qualifications are addressed. Recommendation #10 remains most vague, we have been played again.

 -LS


Monday, June 12, 2023

LB Parking Demand Studies

There are three consultant reports about LB parking capacity and occupancy (the supply and spaces occupied), and solutions for better parking utilization. One consultant study shows us our parking occupancy is filled to 85% capacity but only 5% of the time. Another consultant study shows us downtown off-street parking occupancy is filled 80-100% in summer only, in winter it is 30-60%.  

Now a third consultant retained by LB City disputes these claims in a Parking and Transportation Demand Management Report (Jan 10 2023)* prepared by the Parking Management Subcommittee. The Subcommittee reports high parking occupancy all the time and recommends 11 new parking structures in 18 new parking lots from 23 locations studied.    

"New construction public parking infrastructure is generally a long-term strategy.  However, the Subcommittee also recommends that two significant infrastructure  projects (new multi-level parking structures) be pursued in the medium-term."  

The consultants and their reporting are:

IBI Group:  Existing Parking Analysis & Recommendations for the Downtown Specific Plan Area, Mar 2017

RBF Consultants: Downtown and Laguna Canyon Parking Management Plan (PMP) 2013 

City Council Parking Master Plan Subcommittee: LB Parking and Transportation Demand Management Report (Fehr & Peers Consultants), Jan 2023


IBI Group

Quoting from the study “Based on these observed occupancies and the current public and private parking supply, which was further analyzed according to the area’s land uses, the study resulted in three key findings.”

“Key Finding #1: The City can benefit from reducing the minimum required parking requirements for non-residential uses in the DSP area. The overall actual built supply of parking spaces exceeds overall actual demand.”
“Key Finding #2: Private parking spaces are underutilized. Parking demand in the Downtown Specific Plan area is higher in public parking spaces than in private parking spaces during both summer and non-summer months.”
“Key Finding #3: The Downtown Specific Plan area attracts more visitors during the summer season.”

RBF Consultants

The Consultants summarize the parking occupancy of the downtown and Laguna Canyon areas. The parking capacity in available public owned parking spaces is Summer:1977 Winter:1547. From actual traffic counts the Consultants summarize the off-street parking occupancy in downtown as 30-60% in winter and 80-100% in summer.  These results also do not justify a new permanent parking structure.

• Downtown On-Street Parking Occupancy
    o Summer Weekend/Weekday: 80% – 100%
    o Non-Summer Weekend/Weekday: 60% – 80%
• Downtown Off-Street Parking Occupancy
    o Summer Weekend/Weekday: 80% – 100%
    o Non-Summer Weekend/Weekday: 30% – 60%
• Canyon On-Street Parking Occupancy
    o Summer Weekend: 80% – 100%
    o Summer Weekday: 60% – 90%
    o Non-Summer Weekend: 60% – 80%
    o Non-Summer Weekday: 5% – 15%
• Canyon Off-Street Parking Occupancy
    o Summer Weekend: 70% – 90%
    o Summer Weekday: 40% – 70%

City Subcommittee

Notice the difference in conclusion from the Management Plan Subcommittee, in the parking and PTDMR report (Fehr and Peers) under Benefit to Residents page 39 says:   

Centralized parking creates more incentive for visitors to pay for parking for the convenience, rather than park for free in a residential area further away from their destination. We can reasonably predict that individuals are often willing to pay for this amenity based on the high occupancy trends at the Glenneyre Street parking structure and other public parking facilities.

Under Parking Capacity and Occupancy the report warns readers with this caption of the Village entrance. 

Locating available parking near a destination can be challenging ...... remain at near‐full occupancy throughout  the peak period. Once these areas are effectively full, remaining available parking  may be scattered and difficult to locate.  

The Subcommittee then proposes the solution to over-demand for parking is to add enough parking spaces to hold peak occupancy under 85%, even stacked parking if necessary for a "park once" approach to avoid motorist inconvenience (page 45).  

The conclusion from IBI was the existing built parking supply exceeded overall demand, asked why this conclusion was a contradiction Fehr and Peers had no comment (page 81).  The findings from RBF Consulting are also in contradiction to the Subcommittee recommendations. A winter 30-60% occupancy is already below the 85% occupancy Subcommittee target, however the RBF results were not compared. 

Two outcomes of the PTDMR recommendations were proposed.

(1) to reduce the impact of visitor and employee parking in residential neighborhoods and improve the quality of life for residents; and (2) to enhance mobility in the City’s commercial areas during peak periods to benefit both residents and visitors.
The first outcome to reduce parking occupancy under 85% will never be achieved today due to induced demand for parking, any land-use planner can tell you that.   The second outcome suffers from the same logic of car-culture; adding more car infrastructure to improve mobility simply exacerbate car traffic in our LB Village.

What is NOT in this fabricated report:   "Complete Streets Policy" does not appear anywhere in the 141-page PTDMR. The keywords in the short-list "induced demand, multi modal, mode share, transit" describing a balanced mobility plan to reduce parking demand  does not appear anywhere in the PTDMR.

 In 141-pages the PTDMR has completely ignored the amortized costs of financing, constructing, maintaining, operating and enforcing parking structures. The Subcommittee and City Staff dream of operating 1950 parking lots like a 2023 city  ATM Machine without analyzing life-time facility costs. DO THE MATH as Laguna Streets have done.  Check these parking meter rates for 11 structures and decide if you would park there or in a neighborhood for FREE!

Consultants report the recommendations they are retained to produce. In this case the clear disagreement between three consultants is revealing, the Parking Management Subcommittee has an agenda to sell parking.

-LS

* A new revision June 13 2023 replaces Jan 10 2023 report.


Tuesday, May 23, 2023

LBUSD Facility Master Plan SOW

On May 2 2023 the LB Unified School District revealed plans for a $120 Million replacement of facilities on four campuses, the allocation consists of $88 Million for the LBHS campus. The replacement consists of two parking garages designated  Lot-A and Lot-B on the Facility Master Plan SOW for May 23, 2023, the entire project is estimated to take 10-years to complete.

The project allocates roughly $15 Million for multi-story parking structures at Lot-A and $9 Million for Lot-B located in existing parking lots. Given similar project experience in Lagna Beach these costs may be considerably more. Given the details from the Facility Master Plan, an analysis of the proposed structures reveal the real cost of the development.

Project Assumptions:

Construction time 3-years,   Facility Life: 40-years,   Debt Financing: 30-years

Project Lifetime Debt Considerations:

Construction, Debt Service, Salvage, O&M, In-lieu Fees, Opportunity Cost 

Externalized Costs: VMT, Congestion, Emissions, EIR Review, In-lieu fees

Lot-A and Lot-B Design details:

Lot-A: number of spaces:  existing spaces -113, added - 19

Lot-B: number of spaces:  existing spaces -19, added - 103  


An economic analysis for the lifetime of the structure using a Equivalent Uniform Annualized Cost (EUAC) approach and the assumptions above give the following results. The calculations are a break-even case where amortized project costs are just covered by meter rates. 


The study does not include costs for  parking enforcement,  opportunity costs, environment factors (quakes, floods), depreciation and inflation. 


For each parking lot, the first chart shows the meter rate per hour charged per space at different prevailing interest rates. The meter rate is shown for two cases, one for spaces added and one for all the parking spaces in each lot A and B.  

The second chart shows the accumulated costs for each parking space if the space was rented by the month. It is shocking to realize the monthly cost of each parking space approaches cost of rent for a double occupancy flat in Laguna Beach.

-LS


Tuesday, May 16, 2023

Renewable Replacement Reality

When the IPCC (International Panel on Climate Change) proposes a 1.5-degree cap on global temperature increase by 2030 and net-zero carbon emissions by 2050 by simply substituting renewable energy sources for the dominant hydrocarbon ones, it's time for a reality check (Bill Gates warns do the math).

To show the extent hydrocarbon energy from fossil fuel dominates the global energy mix, consider the reality presented by the Manhattan Institute in a comprehensive March 2019 article.

Google Images
What does the world consumption of fossil energy look like?  If the world consumption of coal and oil were measured in only barrels of oil, then the barrels would line-up from Washington D.C. to Los Angeles, and a stack of barrels equivalent in height to Washington Monument would be consumed every week.

To transition our world civilization dependent on fossil energy to something else like wind and solar, consider these inescapable realities between renewables and hydrocarbon energy.

  • Private vehicle replacement: A 100x growth in the number of electric vehicles to 400 million on the roads by 2040 would displace only five percent of global oil demand.
  • The cost of transition to renewables: A small  2% decline in hydrocarbon share of world energy use entailed over $2 trillion in cumulative global spending on alternatives; solar and wind today supply less than 2% of global energy.
  • The rate of fossil fuel replacement: Global petroleum production grew ten-fold in five decades, renewable energy would have to expand 90-fold to replace global hydrocarbons in two decades. 
  • Energy poverty increases energy demand: When the world’s poorest 4 billion people increase their energy use to just 15% of the per-capita level of developed economies, global energy consumption will rise by the equivalent of adding an entire United States’ worth of demand.
  • Efficiency increases energy demand by making products & services cheaper: due to improving energy efficiency since 1990, global energy efficiency improved 33 percent, the economy grew 80 percent and global energy use is up 40 percent.
  • To make enough batteries to store two day's worth of U.S. electricity demand would require 1,000 years of production by the Tesla Gigafactory.
  • It costs less than $0.50 to store the energy in a barrel of oil, or its equivalent in natural gas, but it costs $200 to store the equivalent energy in batteries.
  • About 60 pounds of batteries are needed to store the energy equivalent of one pound of hydrocarbons.
  • No digital-like 10x gains exist for solar tech: Physics limit for solar cells (the Shockley-Queisser limit) is a max conversion of about 33 percent of photons into electrons; commercial cells today are at 26 percent.

The realities are that both hydrocarbon energy and renewable sources contribute to climate disruption over their life-cycle of discovery, extraction, processing, consumption, waste.  Renewables suffer a cost penalty due their low energy density compared to fossil fuels. Presently no other energy source is remarkable as hydrocarbons in terms of the combination of low-cost, high-energy density, stability, safety, and portability.

A sustainable policy based on these choices faces drawbacks in execution, but there is a third choice. Complete Streets Policy is a demand-side mobility policy consistent with lowering the carbon footprint in our transportation sector by enabling low-carbon transportation modes.

For a comprehensive review of many more energy transition realities, see the article by Manhattan Institute "The 'New Energy Economy': an exercise in Magical Thinking".  ( Manhattan Institute)

-LS

Tuesday, May 2, 2023

Incentives for Bike Month

May is bike month!  Use your bike as a statement for climate action, and the perfect tool for door to door trips within Laguna and you'll never look for parking.  The bike is also the solution for the "last-mile" connector between public transit stations and your destination. Remember Homer's Rules of Mobility.   

Join the Tool for Joy Challenge at People for Bikes where we are celebrating power of the bike as a tool for joy, ride along with us all month as we share the joys of riding a bike for recreation, transportation, community, health and more!

The poppy is a perfect symbol of the transformation we want to see in California, to do so the state has incentivized the removal of wasteful lawns in favor of native flora like the poppy "bringing beautiful diversity of plants designed to thrive in our climate". Support  CalBike with diverse mobility options so all California communities can thrive. Join today to plant the seeds of change, so we can see bike lanes blooming as plentiful as golden poppies across the golden state (Calbike). 

-LS

Wednesday, April 19, 2023

How2 Affordable Housing

Mobility reform 

leads to parking reform

leads to Affordable Housing.

Source: California YIMBY
Credit: California Yimby https://cayimby.org/

First Step:  End Parking Requirements Now.

-LS

Thursday, April 13, 2023

SUV's Cause Peds Cyclists More Severe Injuries

Bike Injury Severity by IIHS
Severity of Injury 1-5 Courtesy Streetsblog.org
Like pedestrians, bike riders struck by SUV motorists endure significantly more severe injuries than those struck by drivers of smaller cars. According to a new study (ScienceDirect) fatal crashes are on the rise since 2009.  Injuries to the head are more common and severe.
 
Well Duh.


Why are SUV's so popular? Would you believe a covert plan by the auto industry endorsed by government?  What are they doing in Laguna Beach? Where's the 'sport' in Sport Utility Vehicle? Why are auto manufacturers marketing SUV's ? Because they can sidestep normal regulations and make more money doing so. Consumers upsold popular trucks F-150 Supercrew Raptor to make higher profits. Best Video on the impact of SUV's. Why do we hate to hear the truth? It could be cognitive dissonance: we hate to hear the truth when it isn't pleasant.

-LS

Thursday, March 30, 2023

Electric Bicycle in Cal Vehicle Code

 These are the paragraphs in California Vehicle Code pertaining to electric bicycles, there new Assembly Bills in process to account  for the variety of different electric bikes entering our roadways.

VEH - 312.5. - DIVISION 1. WORDS AND PHRASES DEFINED [100. - 681.]

...(a)An “electric bicycle” is a bicycle equipped with fully operable pedals and an electric motor of less than 750 watts. (1)A “class 1 electric bicycle,” or “low-speed pedal-assisted electric bicycle...
VEH - 21213. - ARTICLE 4. Operation of Bicycles [21200. - 21213.]

...(a)A person under 16 years of age shall not operate a class 3 electric bicycle. (b)A person shall not operate a class 3 electric bicycle, or ride upon a class 3 electric bicycle...
VEH - 21207.5. - ARTICLE 4. Operation of Bicycles [21200. - 21213.]

... or recreational trail, may prohibit, by ordinance, the operation of an electric bicycle or any class of electric... the operation of an electric bicycle or any class of electric bicycle on any bicycle path or trail...
VEH - 24016. - CHAPTER 1. General Provisions [24000. - 24019.]

...(a)An electric bicycle described in subdivision (a) of Section 312.5 shall meet the following... operating an electric bicycle is not subject to the provisions of this code relating to financial...
VEH - 467.5. - DIVISION 1. WORDS AND PHRASES DEFINED [100. - 681.]

...“Pedicab” means any of the following: (a)A bicycle, including an electric bicycle, that has three.... (b)A bicycle, including an electric bicycle, that pulls a trailer, sidecar, or similar...
VEH - 231. - DIVISION 1. WORDS AND PHRASES DEFINED [100. - 681.]

... and 21200.5. An electric bicycle is a bicycle. Amended by Stats. 2021...
VEH - 554. - DIVISION 1. WORDS AND PHRASES DEFINED [100. - 681.]

...“Shared mobility device” means an electrically motorized board, as defined in Section 313.5, motorized scooter, as defined in Section 407.5, electric bicycle, as defined in Section 312.5, bicycle...
VEH - 21113. - ARTICLE 3. Local Regulation [21100. - 21118.]

... the conditions for, the use of bicycles, motorized bicycles, electric bicycles, skateboards... bicycles, electric bicycles, skateboards, electrically motorized boards, and roller skates on public...
VEH - 12804.9. - ARTICLE 3. Issuance and Renewal of Licenses [12800. - 12819.]

... with an attached motor, except an electric bicycle as described in subdivision (a) of Section...
VEH - 12804.9. - ARTICLE 3. Issuance and Renewal of Licenses [12800. - 12819.]

... motor, except an electric bicycle as described in subdivision (a) of Section 312.5. (B... 
 
-LS